Please attempt the questions before reading these answers!
Q1
1.1. \(\alpha\) is the \(y\)-intercept of the regression line \(\mathbb{E}(Y) = \alpha + \beta x\).
1.2. \(\beta\) is the gradient of the regression line \(\mathbb{E}(Y) = \alpha + \beta x\).
Q2
2.1. A residual is the difference between the observed value \(y_i\) and the estimated value \(\mathbb{E}(Y_{i})\).
2.2. It minimizes the squared sum of the residuals to find the optimal regression line for a sample of data.
Q3
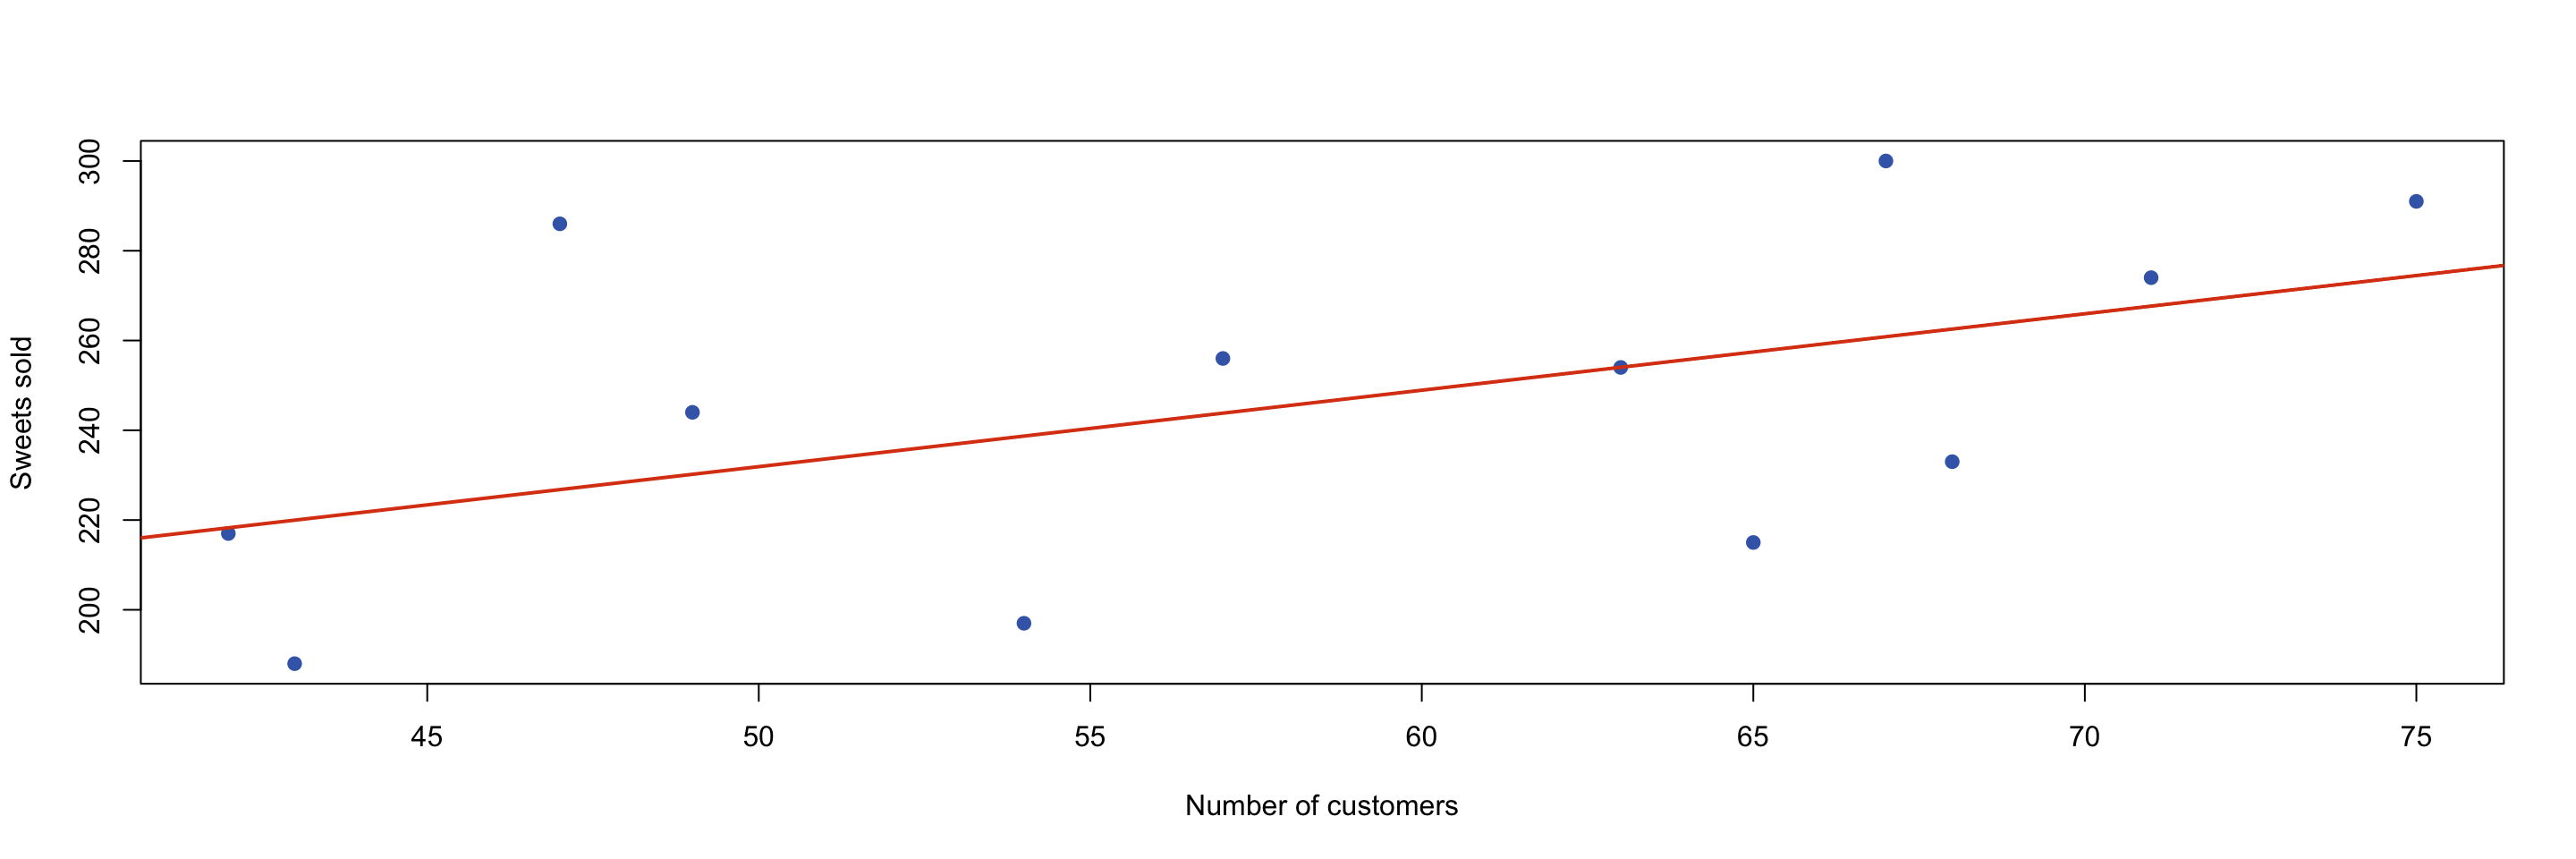
3.1. Here, \(\hat{\alpha} = 146.6853\).
3.2. Here, \(\hat{\beta} = 1.7044\).
3.3. \(\mathbb{E}(Y) = \alpha + \beta x = \hat{\alpha} + \hat{\beta} x = 146.6853 + 1.7044 x\)
3.4. The \(R^2\) coefficient of determination is \(0.2691\), which suggests that the response variable is not well modelled by a linear model of the explanatory variable.
Please note that for this question, the following R code was used. It is recommended that you use Calculator: Simple linear regression or statistical software like this to do these calculations, as these can be very tedious to do by hand.
confectionery =data.frame(customers=c(43,54,65,42,68,49, 63,57,71,47,75,67),sweets=c(188,197,215,217,233,244,254,256,274,286,291,300))model=lm(sweets~customers,data=confectionery)summary(model)plot(confectionery$customers, confectionery$sweets,pch =19, col ="#3f68b6",xlab ="Number of customers",ylab ="Sweets sold")abline(model, col ="#db4315", lwd =2)
Code output:
Call:
lm(formula = sweets ~ customers, data = confectionery)

Residuals:
    Min      1Q  Median      3Q     Max
-42.471 -30.181   3.121  14.471  59.208

Coefficients:
            Estimate Std. Error t value Pr(>|t|)
(Intercept) 146.6853    52.7694   2.780   0.0195 *
customers     1.7044     0.8882   1.919   0.0839 .
---
Signif. codes:  0 '***' 0.001 '**' 0.01 '*' 0.05 '.' 0.1 ' ' 1

Residual standard error: 33.36 on 10 degrees of freedom
Multiple R-squared:  0.2691,    Adjusted R-squared:  0.1961
F-statistic: 3.683 on 1 and 10 DF,  p-value: 0.08395
Version history and licensing
v1.0: initial version created 12/25 by Flora Green as part of a University of St Andrews VIP project.
Your feedback is appreciated and useful. Feel free to leave a comment here,
but please be specific with any issues you encounter so we can help to resolve them
(for example, what page it occured on, what you tried, and so on).