Answers: Introduction to probability
These are the answers to Questions: Introduction to probability.
Please attempt the questions before reading these answers!
Q1
(Note: accept all simplified fractions, or probabilities represented in decimal and percentage forms)
1.1.

1.2.
1.3.
The events in Q1.1.(b) are independent.
The events in Q1.1.(c) are dependent.
The events in Q1.2. are independent.
Q2
(Note: accept all simplified fractions, or probabilities represented in decimal and percentage forms)
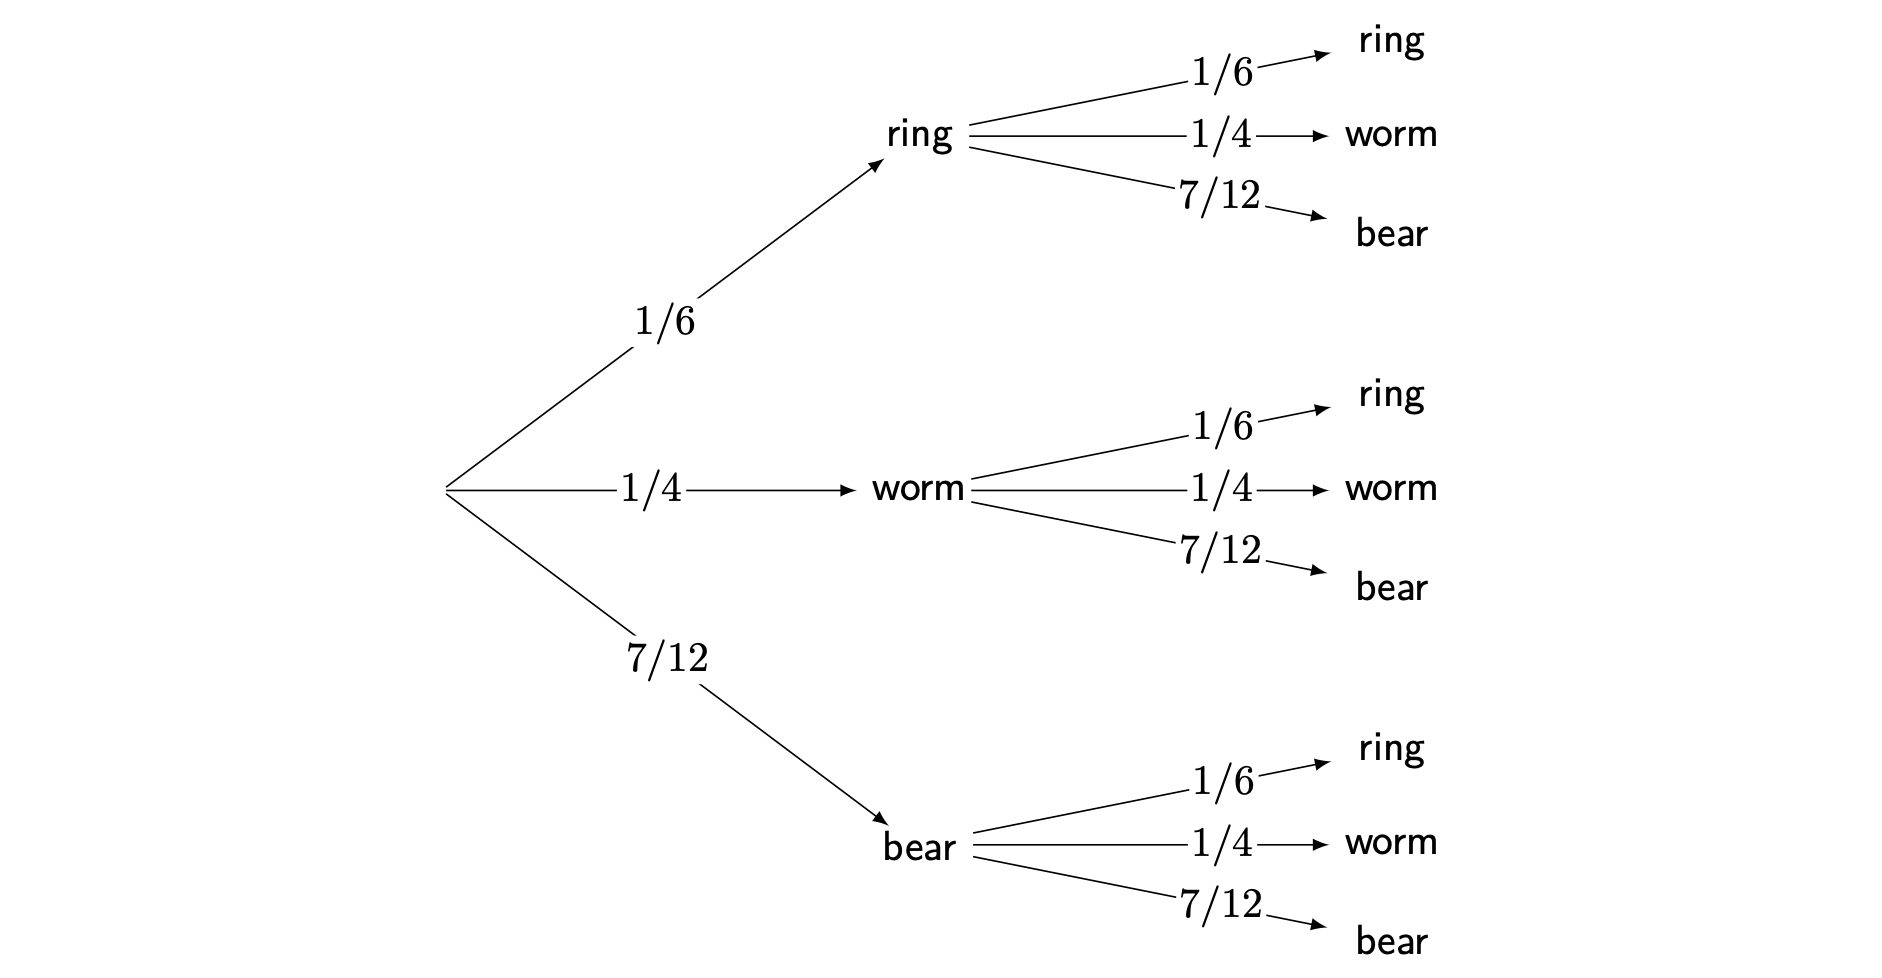
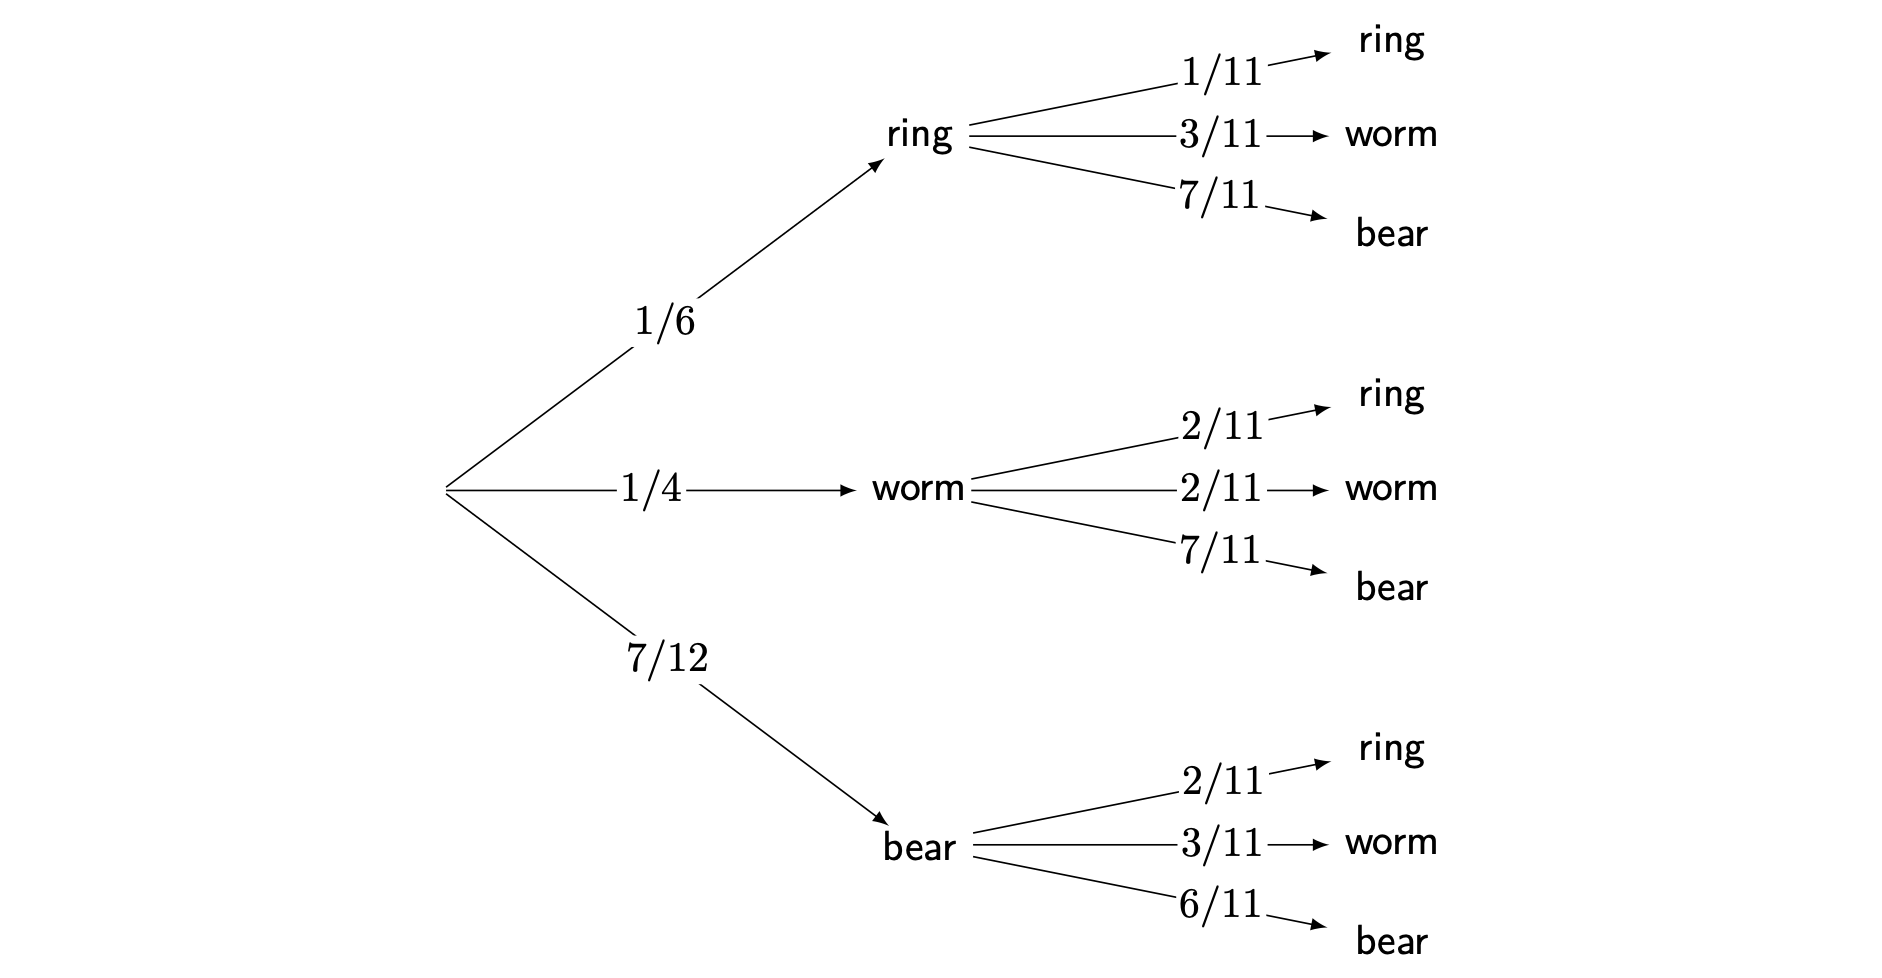
2.1.
\(\mathbb{P}(\textsf{gummy bear}) = \frac{7}{12}\). Therefore, apply the complement rule to calculate the complement of \(\mathbb{P}(\textsf{gummy bear})\), so \(\mathbb{P}(\textsf{gummy bear}') = 1-\frac{7}{12}=\frac{5}{12}\).
The probability of drawing a gummy ring the first time is \(\frac{2}{12}\), and the probability of drawing a gummy ring the second time is also \(\frac{2}{12}\). Therefore, \(\mathbb{P}(\textsf{gummy ring and gummy ring})=(\frac{2}{12})(\frac{2}{12})=\frac{4}{144}=\frac{1}{36}\).
The probability of drawing a gummy bear the first time is \(\frac{7}{12}\), and the probability of drawing a gummy worm the second time is \(\frac{3}{11}\). Therefore, \(\mathbb{P}(\textsf{gummy bear then gummy worm})=(\frac{7}{12})(\frac{3}{11})=\frac{21}{132}=\frac{7}{44}\).
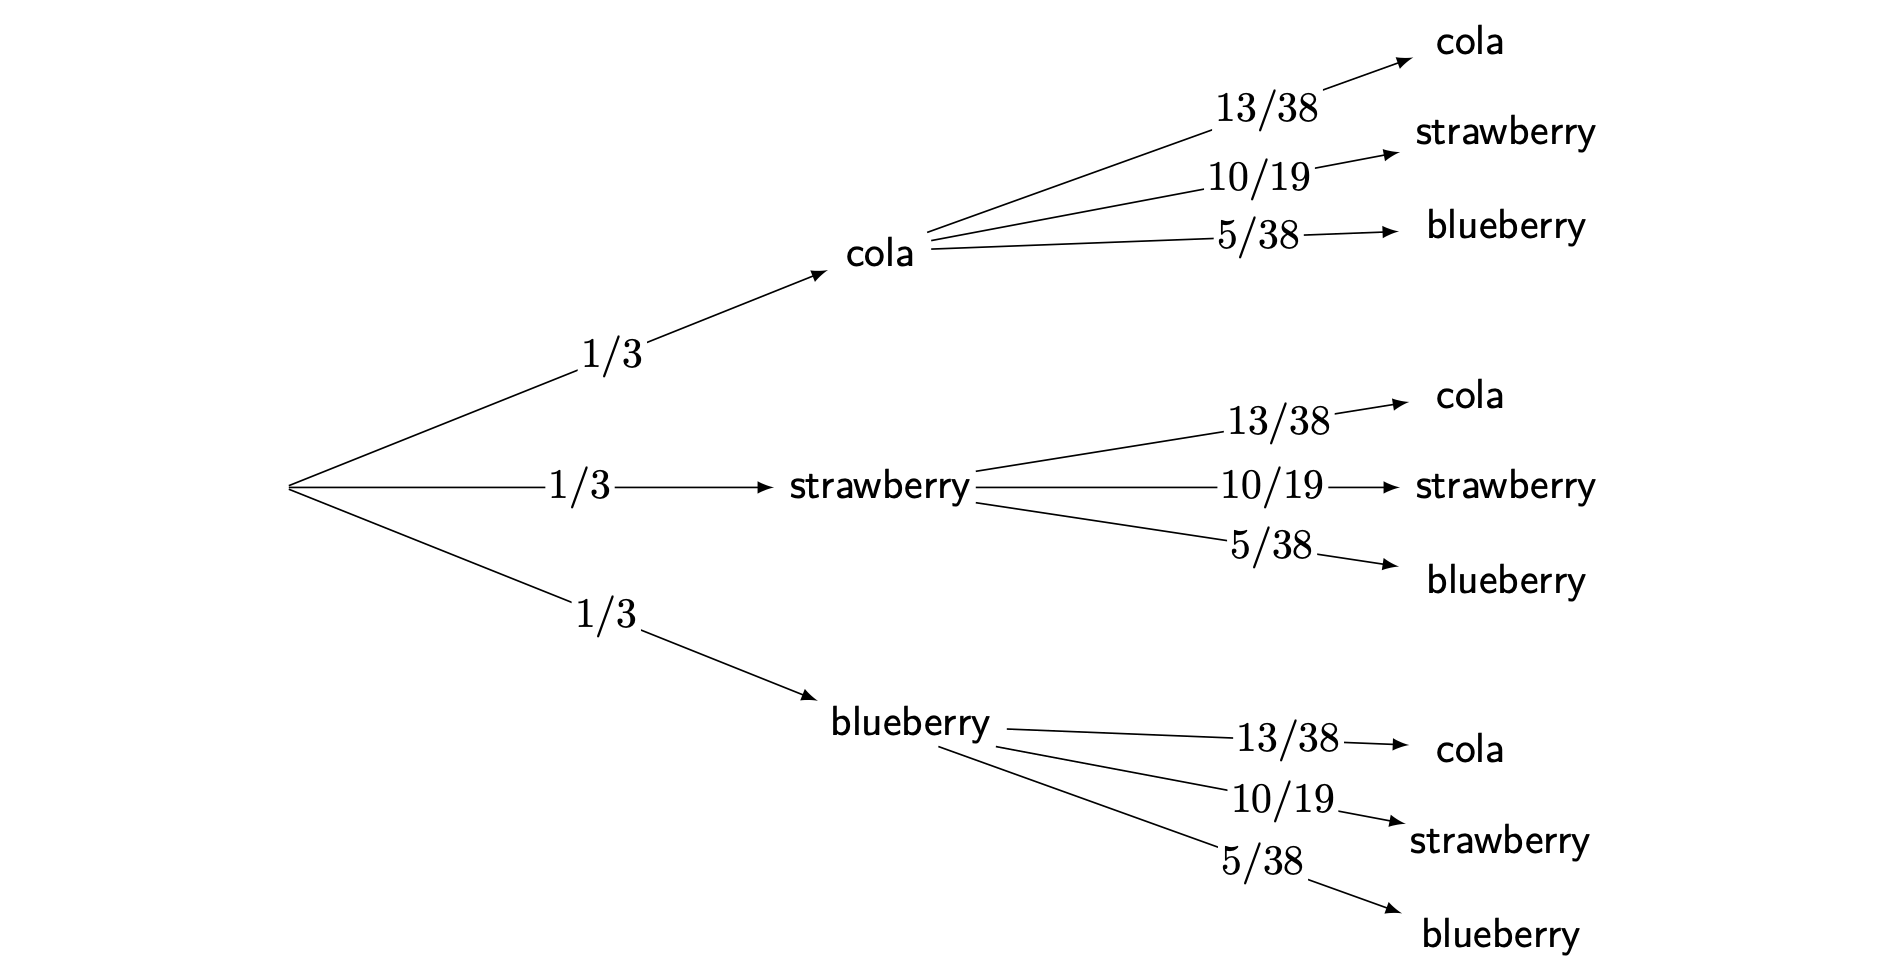
2.2. The probability of drawing a cola flavored jelly bean the first time is \(\frac{10}{30}\), and the probability of drawing a strawberry flavored jelly bean the second time is \(\frac{20}{38}\). Therefore, \(\mathbb{P}(\textsf{soda and strawberry})=(\frac{10}{30})(\frac{20}{38})=\frac{200}{1140}=\frac{10}{57}\).
Q3
3.1. This is an example of experimental probability.
3.2. The total number of spins is 60, and it lands on white 17 times. Therefore, \(\mathbb{P}(\textsf{white})=\frac{17}{60}\), so by the complement rule, \(\mathbb{P}(\textsf{white}')=1-\frac{17}{60}=\frac{43}{60}\).
3.3. The spinner is unbiased (meaning the probability is uniform), so there are four possible colors that the spinner is equally likely to land on. Calculating the theoretical probability, \(\mathbb{P}(\textsf{red})=\frac{1}{4}\).
3.4. As you spin the spinner more times, the experimental probabilities of each color will get closer to their theoretical probabilities.
Q4
4.1. The sample space is \(\{1,2,3,4,5,6,7,8,9,10,11,12,13,14,15,16,17,18,19,20\}\), which contains 20 possible outcomes. The subset of the sample space with a value above 12 is \(\{13,14,15,16,17,18,19,20\}\), which contains 8 out of the 20 possible outcomes. Therefore, \(\mathbb{P}(\textsf{success})=\frac{8}{20}=\frac{2}{5}\).
4.2. The possible outcomes of the 5-sided dice roll are \(\{1,2,3,4,5\}\). Adding 3 to each number, the sample space becomes \(\{(1+3),(2+3),(3+3),(4+3),(5+3)\}=\{4,5,6,7,8\}\). The sample space contains 5 possible outcomes, and the subset of the sample space that contains values 5 and above is \(\{5,6,7,8\}\), which contains 4 out of 5 possible outcomes. Therefore, \(\mathbb{P}(x\ge5)=\frac{4}{5}\) where \(x\) points of damage are dealt to the dragon.
4.3. Here is the sample space represented as a table:
| 1 | 2 | 3 | 4 | |
|---|---|---|---|---|
| 1 | (1,1) | (1,2) | (1,3) | (1,4) |
| 2 | (2,1) | (2,2) | (2,3) | (2,4) |
| 3 | (3,1) | (3,2) | (3,3) | (3,4) |
| 4 | (4,1) | (4,2) | (4,3) | (4,4) |
For convenience purposes, all outcomes that do not contain a 4 are then marked with an asterisk (although any way of marking or counting these outcomes are acceptable):
| 1 | 2 | 3 | 4 | |
|---|---|---|---|---|
| 1 | (1,1)* | (1,2)* | (1,3)* | (1,4) |
| 2 | (2,1)* | (2,2)* | (2,3)* | (2,4) |
| 3 | (3,1)* | (3,2)* | (3,3)* | (3,4) |
| 4 | (4,1) | (4,2) | (4,3) | (4,4) |
There are 16 total possible outcomes in the sample space, and there are 9 outcomes that do not contain a 4. Therefore, \(\mathbb{P}(\textsf{failure})=\frac{9}{16}\).
4.4. Here is the sample space represented as a table:
| 1 | 2 | 3 | 4 | |
|---|---|---|---|---|
| 1 | (1,1) | (1,2) | (1,3) | (1,4) |
| 2 | (2,1) | (2,2) | (2,3) | (2,4) |
| 3 | (3,1) | (3,2) | (3,3) | (3,4) |
| 4 | (4,1) | (4,2) | (4,3) | (4,4) |
| 5 | (5,1) | (5,2) | (5,3) | (5,4) |
| 6 | (6,1) | (6,2) | (6,3) | (6,4) |
| 7 | (7,1) | (7,2) | (7,3) | (7,4) |
| 8 | (8,1) | (8,2) | (8,3) | (8,4) |
| 9 | (9,1) | (9,2) | (9,3) | (9,4) |
The results of the two dice rolls can then be added together:
| 1 | 2 | 3 | 4 | |
|---|---|---|---|---|
| 1 | 2 | 3 | 4 | 5 |
| 2 | 3 | 4 | 5 | 6 |
| 3 | 4 | 5 | 6 | 7 |
| 4 | 5 | 6 | 7 | 8 |
| 5 | 6 | 7 | 8 | 9 |
| 6 | 7 | 8 | 9 | 10 |
| 7 | 8 | 9 | 10 | 11 |
| 8 | 9 | 10 | 11 | 12 |
| 9 | 10 | 11 | 12 | 13 |
For convenience purposes, all outcomes with skill levels that are greater than 9 are then marked with an asterisk (although any way of marking or counting these outcomes are acceptable):
| 1 | 2 | 3 | 4 | |
|---|---|---|---|---|
| 1 | 2 | 3 | 4 | 5 |
| 2 | 3 | 4 | 5 | 6 |
| 3 | 4 | 5 | 6 | 7 |
| 4 | 5 | 6 | 7 | 8 |
| 5 | 6 | 7 | 8 | 9 |
| 6 | 7 | 8 | 9 | 10* |
| 7 | 8 | 9 | 10* | 11* |
| 8 | 9 | 10* | 11* | 12* |
| 9 | 10* | 11* | 12* | 13* |
There are 36 total possible outcomes in the sample space, and there are 10 outcomes where the skill level exceeds 9 points. Therefore, \(\mathbb{P}(x>9)=\frac{10}{36}=\frac{5}{18}\) where \(x\) is the number of skill level points.
Version history and licensing
v1.0: initial version created 04/25 by Michelle Arnetta as part of a University of St Andrews VIP project.