(three ticks){=html}
embeddable content
(three ticks)
with API key
format:
  html:
    include-in-header:
    - text: <script src="desmos_API_key_link"></script>
then use Desmos’ documentation to start building (clickable) (step 1 covered by above)
without API key
- draw graph using Desmos graphical calculator
- share button / ‘embed snapshot’
- paste iframe code into html tags in Quarto
(three ticks){=html}
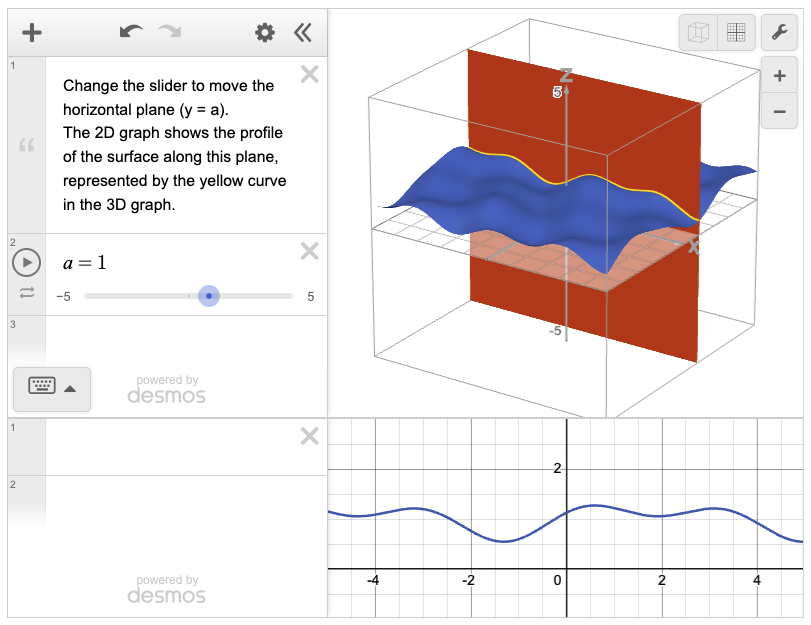
Desmos iframe
(three ticks)
for Shinylive, no server
format:
  html:
    include-in-header:
    - text: <script src="https://esm.sh/shinylive-r"></script>
    filters:
    - shinylive
[three ticks]{shinylive-r}
#| standalone: true
#| viewerHeight: 500
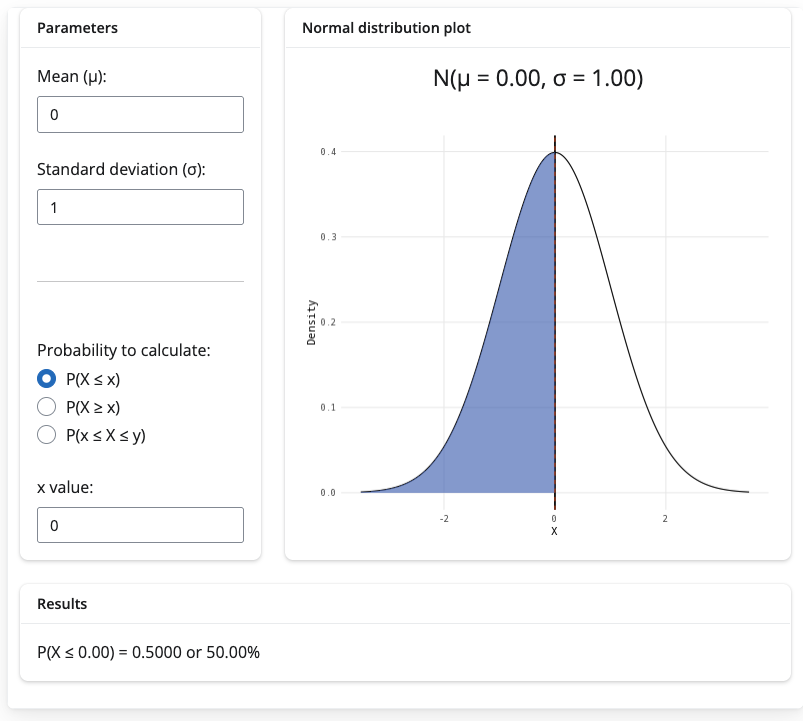
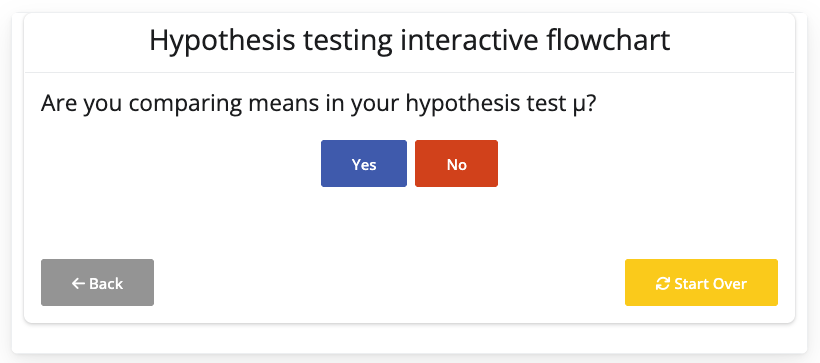
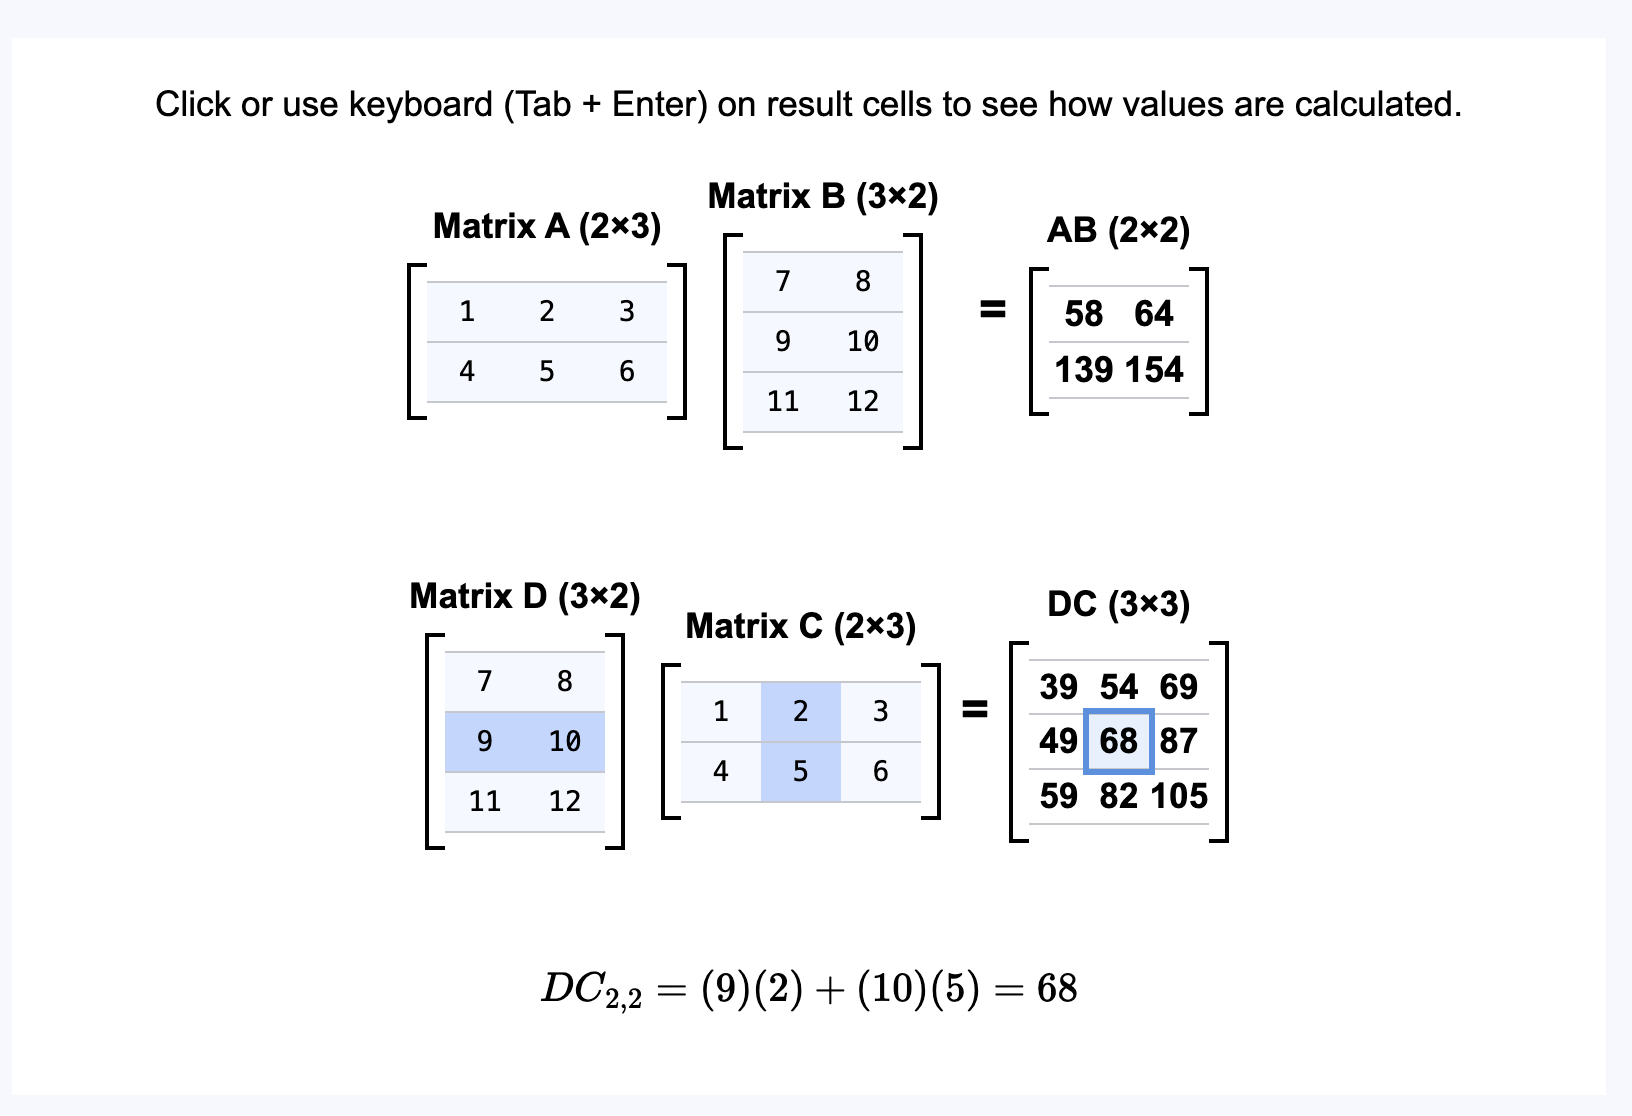
R Shiny app here
[three ticks]
[three ticks]{r, setup, include = FALSE}
library("webexercises")
[three ticks]
- follow documentation to create
webex-boxes where you want questions in your text